Crude oil may not only be the best commodity play for 2012, it could prove to be the best commodity play of the next three to four years, soundly beating both gold and silver. I’m not talking about oil producers, refiners or drillers…or any individual stock — but the real thing: crude oil itself.
Don’t get us wrong, we still like gold and silver and will probably recommend jumping back into silver shortly. But you can’t pour gold into a farm tractor and use it to grow more food. You can’t pump silver into a 747 and use it to transport cargo. You can’t use gold or silver to make overall production more efficient and generate a higher standard of living. In fact, you can’t do any of these things without crude oil. This is why crude is and will continue to be the world’s most essential commodity.
5 Reasons to Buy Crude Oil Now
1) Oil supplies have peaked — oil supply lags discovery by approximately 40 years. New oil discoveries peaked in 1965. Not surprisingly, production has basically flat-lined since 2005. Despite all the press given to new deep water discoveries and North American shale supplies, new production is not keeping up with the depletion of old wells.
2) Producing nations are consuming more of their own output and exporting less. Saudi Arabia, Iran, Norway and Venezuela are exporting far less oil than they did in 2006.
3) Global population is growing rapidly and more people are growing accustomed to better, more energy-dependent lifestyles.
4) Crude oil is decoupling from the dollar. For most of 2011, crude oil was a “risk on”, short dollar play. No longer. Crude is rallying in both strong and weak dollar environments. This is bullish.
5) The odds of a preemptive strike against Iran (the 3rd largest oil producer) are the highest they’ve been in years. 33% of global tanker traffic passes through the Strait of Hormuz which Iran has threatened to close in retaliation for global trade sanctions. Expect it to make good on those threats if bombs start falling on its nuclear facilities.
Therefore, we believe crude has a better chance of doubling from its current $100 per barrel level than gold has doubling from its current levels of $1,575 per ounce. It’s not that we hate gold. We don’t. Some of the same conditions that favor crude will also favor the shiny stuff. But for “bang for the buck,” we feel crude oil is the best opportunity on the board right now.
What is the best way to play it? Energy stocks tend to under perform actual energy products during bullish price spikes. Producer/processor Exxon rose 23.3% and refiner Valero rose 54.5% during crude’s last run-up to $147 per barrel in 2008. Crude oil itself nearly tripled. Why trade crude oil producers, refiners and drillers when we can just trade crude oil itself?
I recommend using NYMEX crude oil options. NYMEX crude oil options are the most liquid (no pun intended) oil option market in the world — making buying and selling them about as easy as buying and selling most stocks. NYMEX crude options are a DIRECT PLAY on the price of the oil itself. NYMEX crude oil options also provide big leverage with fixed risk. That means we can devote a small amount of capital to our oil investment while keeping the bulk of our hard-earned dollars in safe, interest-bearing instruments.
There are many different ways to structure a bullish trade on crude oil. But I recommend the kinds of structures that provide plenty of time for the trade to succeed. Even though I expect crude to make a very strong move to the upside in 2012, I could certainly be wrong about that. So my favorite way to bet on crude oil right now is to utilize a “bull call spread” that does not expire until 2015.
This professional trading strategy may sound complicated, but it is really quite simple. And more importantly, is one of the safest options strategies that professional investors use. The bull call spread I like right now combines two different options. The first gives the investor the right to own 1,000 barrels of crude oil at $125 per barrel. The second option creates obligation to sell 1,000 barrels of crude oil at $150 per barrel.
So that means the investor has the right to buy crude oil at $125, but must also sell that crude oil at $150. Therefore, the investor can make the $25 per barrel difference, but no more. $25 times the 1,000 barrel contract size equals $25,000. Subtract the $3,000 cost of the trade to get a net potential of $22,000 — that’s a 7-to-1 maximum upside.
If the trade does not work out as hoped, the investor’s maximum possible loss would be the initial $3,000 cost of the trade. That’s the kind of risk/reward opportunity I like. Oil is a buy…maybe the very best buy in the entire commodity sector.
By Steve Belmont for The Daily ReckoningOther Related Stories

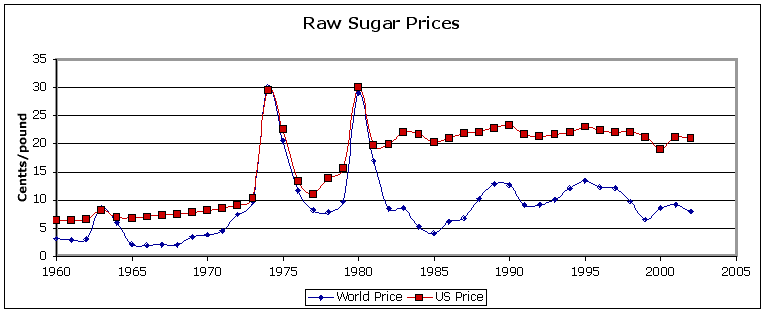 Quotas on US Sugar Imports: Under the sugar import quota system (which started in 1983?) imports of raw sugar are limited to about 3 billion pounds (about 15% of US consumption). Since 1995 the world price of sugar has shown a downward trend. Normally, if the world price falls relative to the US price, we would expect imports to increase. However, under the quota system, the quotas allocated to sugar importers decreased during this time. From the data, it seems as if imports are restricted to a level which keeps the US price above 20 cents per pound.
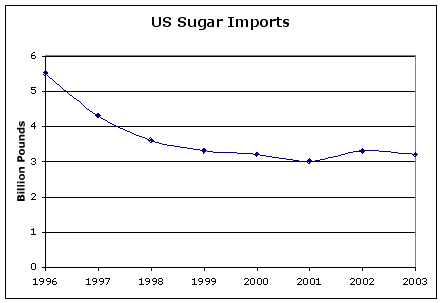
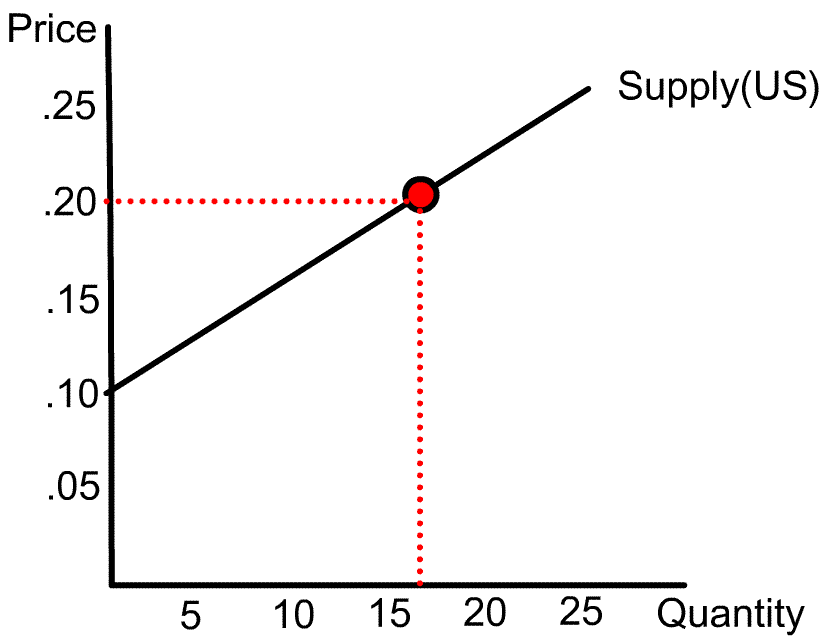
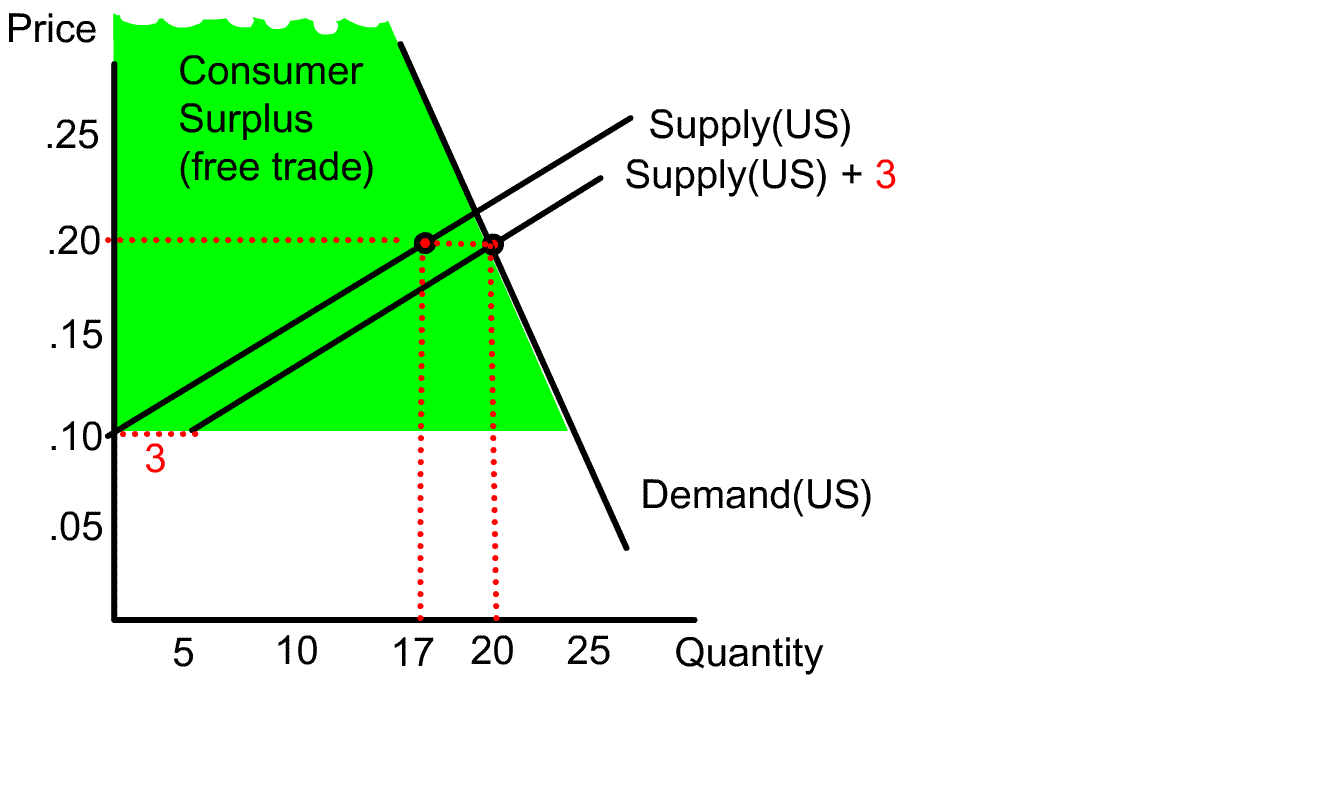
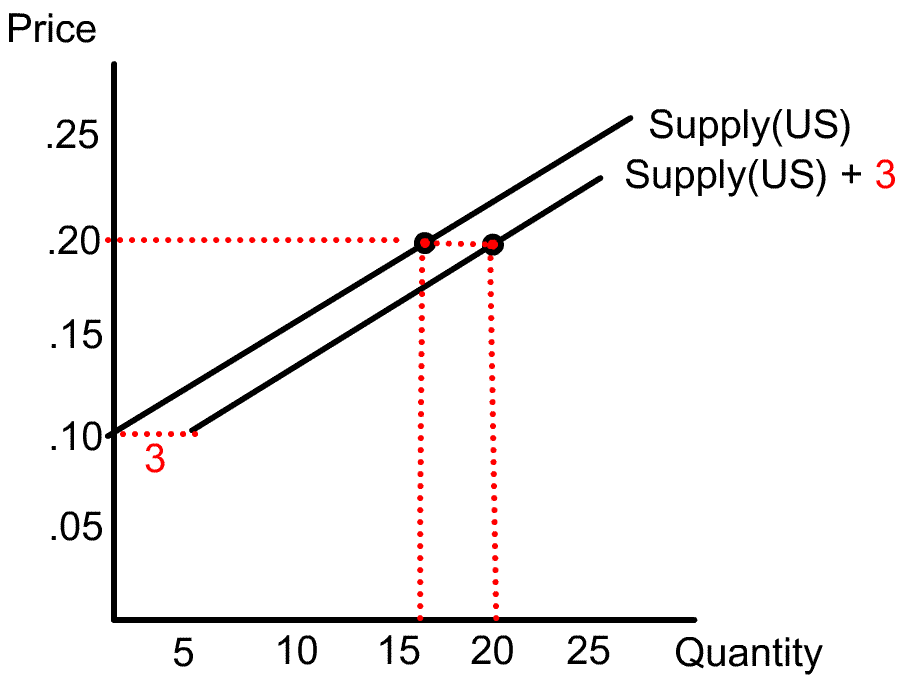 Step Two The sugar import quota system has operated to limit US imports of sugar to 3 billion pounds. So the total supply of sugar in the US market is the Supply(US) plus the 3 that can be imported. This is shown as “Supply(US) + 3” in the diagram to the right..
 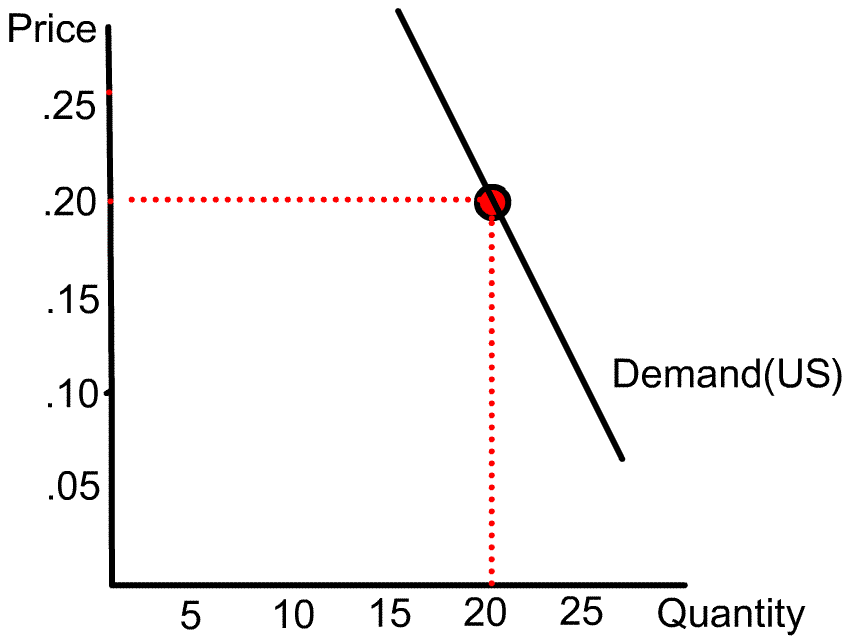 Step Three: We know that when the price in the US is 20 cents per pound US consumers buy about 20 billion pounds, so the US demand curve goes through the point P=.20 and Q=20. This is done in the diagram to the right. Step Four: Putting the supply and demand together we can see how the import quota is set at 3 so that 20 cents is the market equilibrium price in the US .
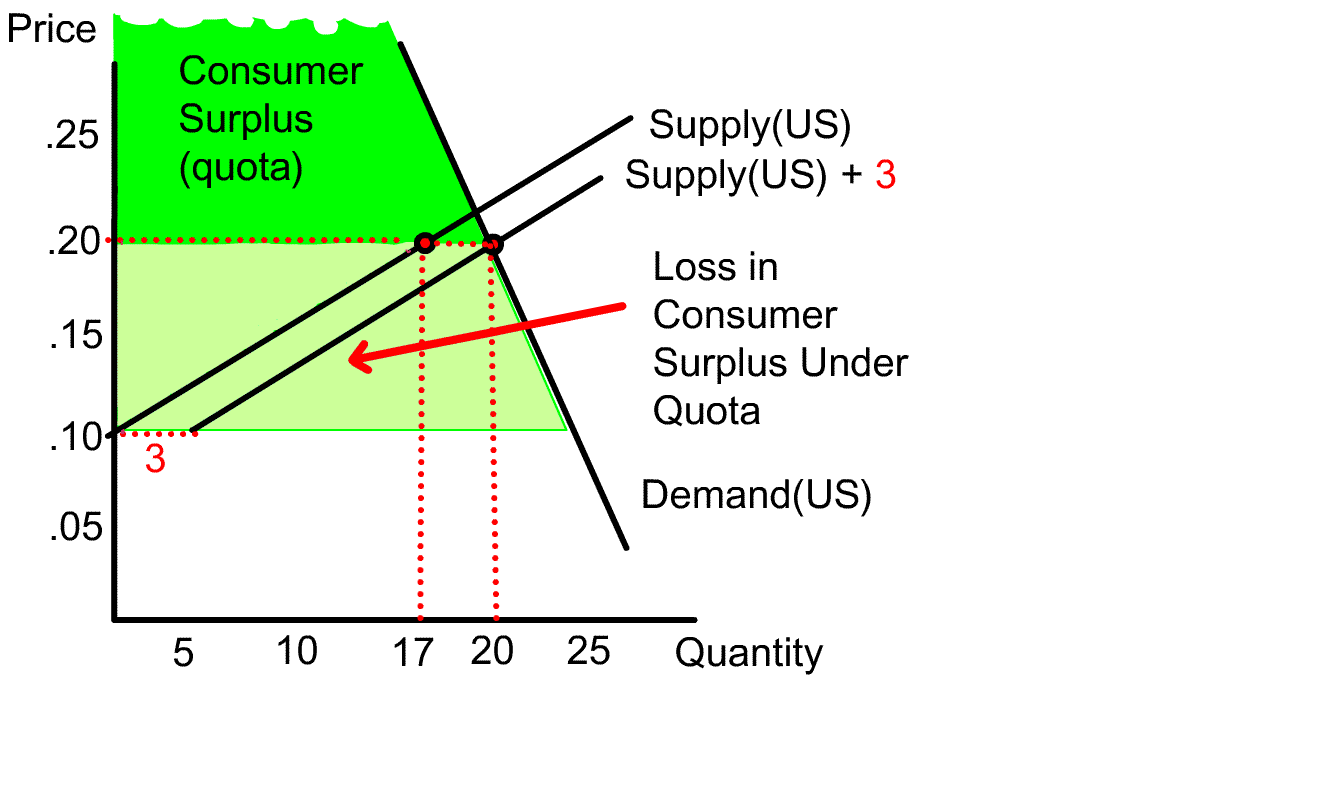
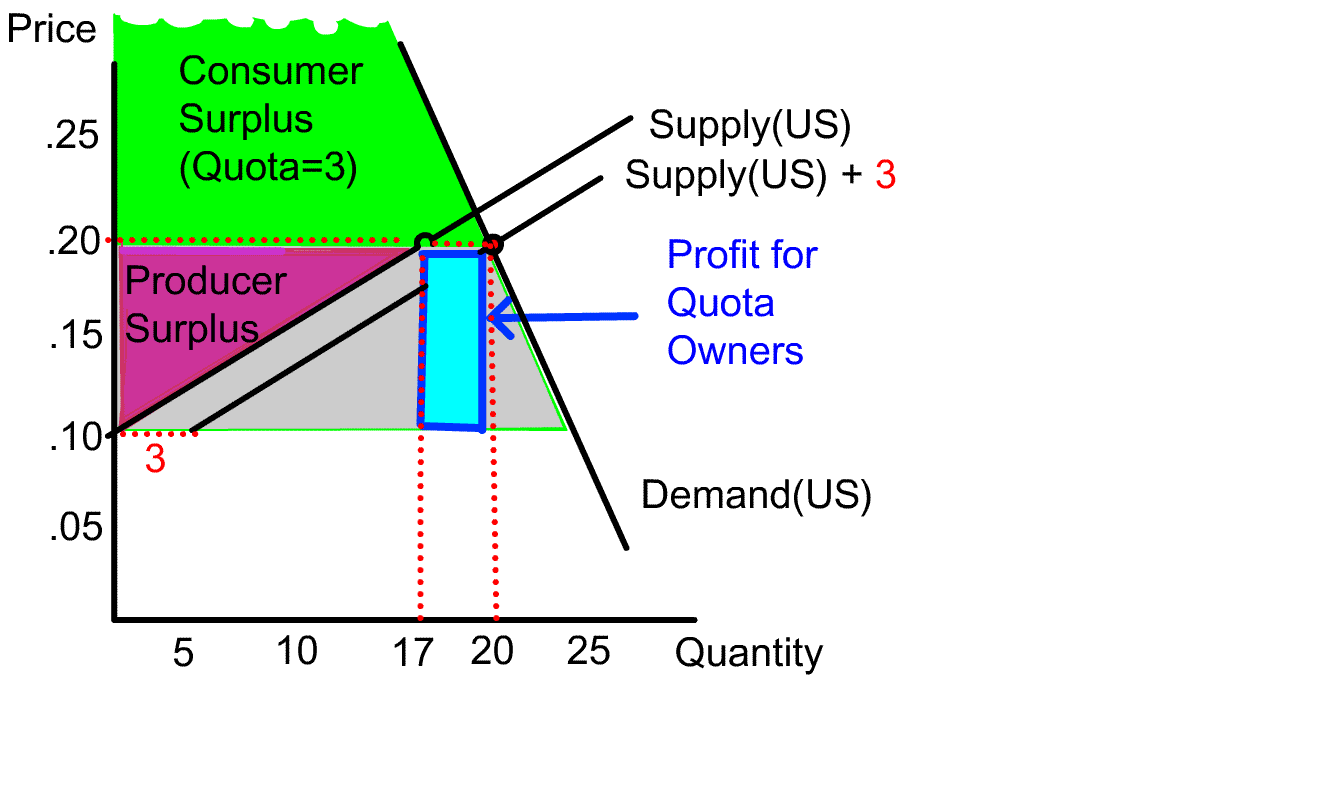
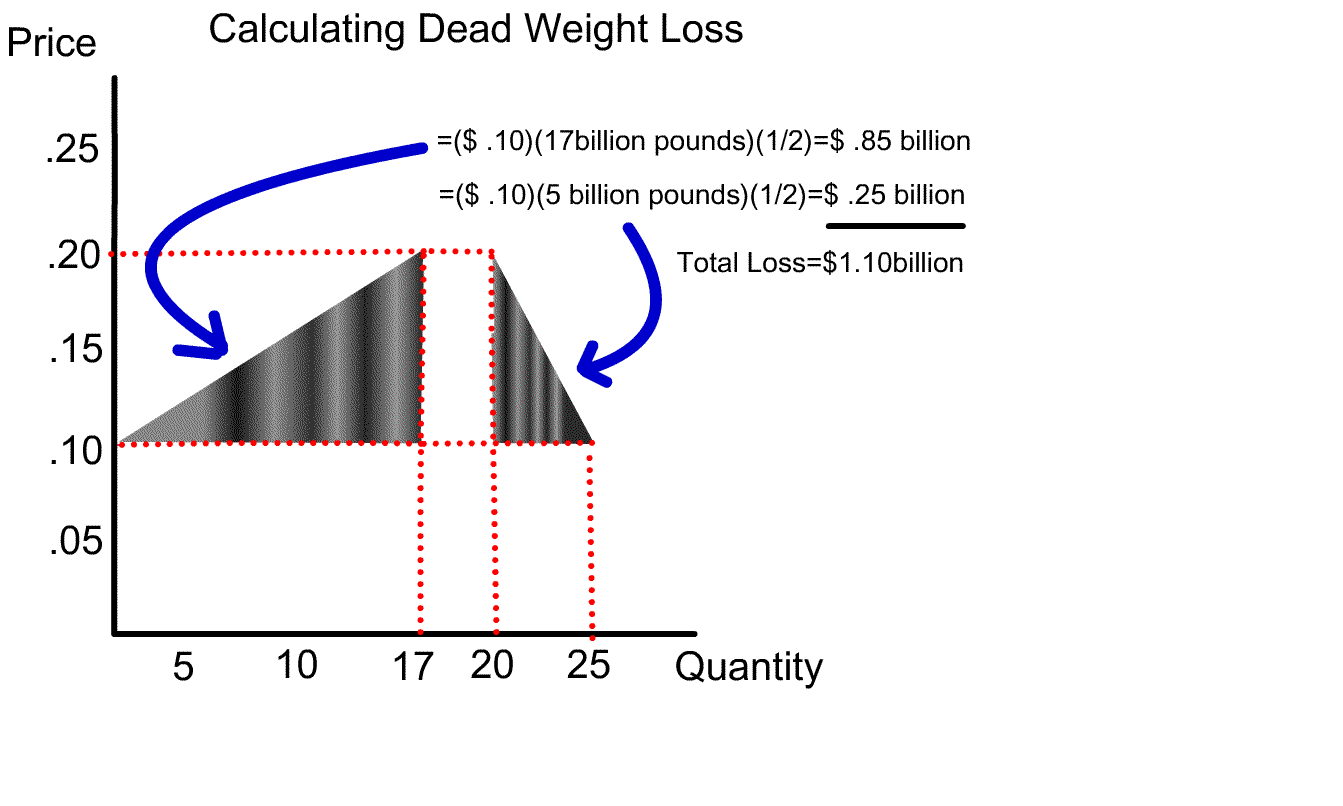
 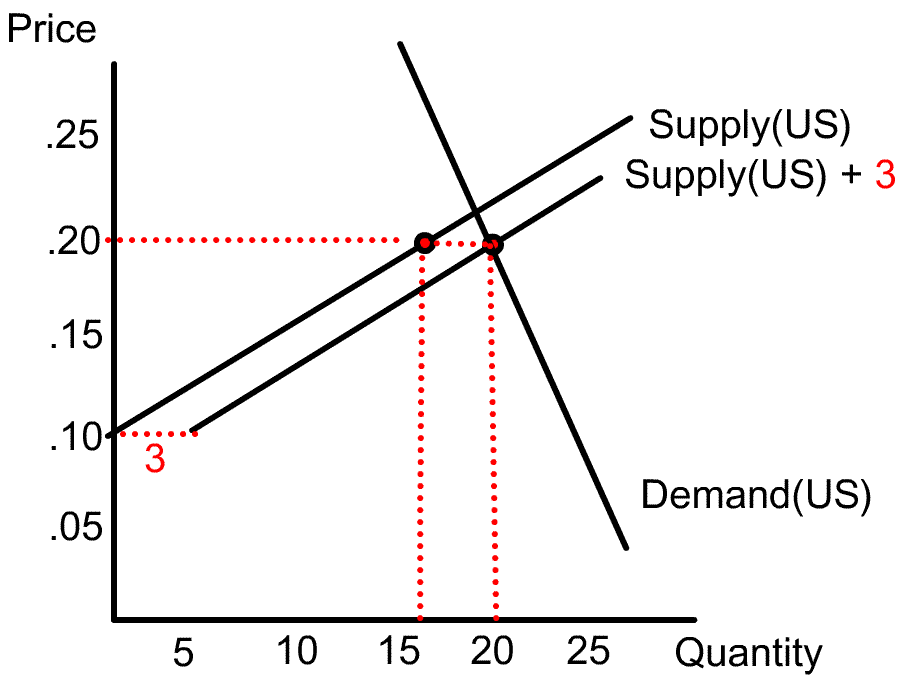 Calculating the magnitude of the efficiency loss caused by the sugar import program:Economists argue that trade is benficial to both buyers and sellers. From this it follows that restricitions on trade, like the sugar import program, will cause some loss in efficiency. Now it may be that, as a country, we are willing to incur some efficiency loss in order to pursue some other objective like preserving agricultural lifestyles. Many developed countries restrict trade in agricultural products to protect their domestic farmers. The Japanese restrict rice imports and the Norwegians restrict dairy product imports. The US restricts sugar imports. One job for economists is to calculate the costs of such programs so that more informed decisions can be made about whether it is too costly to have programs like the sugar import quota program. If the cost to the US is only $1 million per year, maybe the program is a cheap way to protect farmers and maintain a vibrant ag community. But if the cost is $100 billion, maybe not.