Import Quotas
Import Quotas are a “non-tariff trade barrier”
used to limit imports of particular products.
By limiting imports these quotas
can be used to stabilize the US price above the world price for the protected
products.
US suppliers benefit from the higher prices. Supporters of import
quota policies note that the policy gives protection to domestic industry with
no cost to the American taxpayer.
Those who receive the import quotas get the right to buy a product at the lower world price and sell the product in the US for a higher price,so the quotas are valuable rights allocated by the US government to foreign governments it wishes to support. The costs of an import quota program are born largely by consumers of the product subject to import quotas.
US Sugar
Import Quota Program.
Note the chart below of world US prices for raw sugar (not yet refined).
The US inititated the import quota system for sugar in the early 1980s.
Since then the world price of sugar has ranged from less than 5 cents to 13 cents per pound.
Recently the world price has been below 10 cents.
Within the US the price has mostly ranged bewtween 20 and 24 cents.
Products Under US Import Quotas
- Sugar and products with more than 65% sugar content
- Tobaccco
- Peanuts and peanut butter
- Many specific dairy products (e.g. powdered milk, baby formula)
- Cotton
- Beef
- Animal feed
- Anchovies
- Wire rod
- Ethyl alcohol
- Olives
- Mandarin oranges
- Tuna
- Brooms and others. For more information see the US Customs Department: www.customs.gov
 |
|||||||
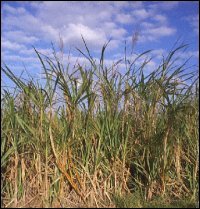
Sugar Cane

Sugar Beets
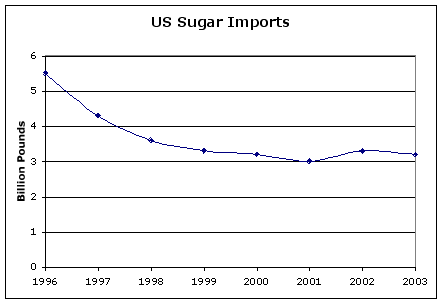
The Rule of One Price: Economists argue that markets, if allowed to function freely, will generate one price for traded products. What they have in mind is that if, for example, the price of sugar was higher in the US than in Mexico, then someone could make a profit through arbitrage (buying low and selling high). If traders bought sugar in Mexico to sell in the US, then the extra demand in Mexico would raise the price of sugar in Mexico, and the extra sugar supplied by traders to the US would operate to lower the price of sugar in the US, and this would continue until the price of sugar was the same on each side of the border. Of course, even if markets were free to operate like this, prices differences which reflect transport, storage, and risk costs will persist. The price data charted below show that when world prices are very high (mid 1970s and around 1980) the rule of one price seems to hold for sugar. Otherwise, US sugar policy has operated to prevent the US price of sugar from falling to world price levels. 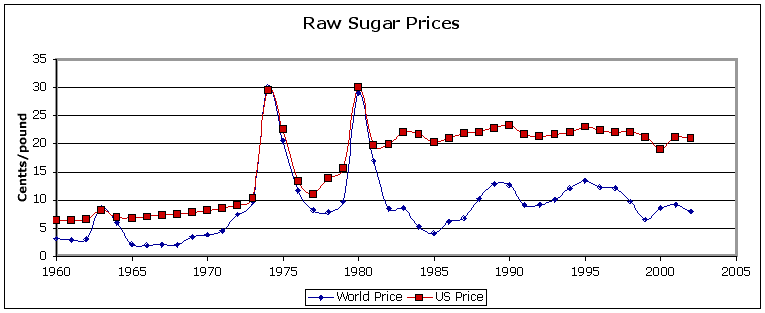 Quotas on US Sugar Imports: Under the sugar import quota system (which started in 1983?) imports of raw sugar are limited to about 3 billion pounds (about 15% of US consumption). Since 1995 the world price of sugar has shown a downward trend. Normally, if the world price falls relative to the US price, we would expect imports to increase. However, under the quota system, the quotas allocated to sugar importers decreased during this time. From the data, it seems as if imports are restricted to a level which keeps the US price above 20 cents per pound.
Using the Trade Model for Import Quotas: We can construct our model of the US sugar market to fit data which appoximate current conditions in the market:US Price: 20 cents per poundWorld Price: 10 cents per pound
US Production: 17 billion pounds
US Imports: 3 billion pounds
US Consumption 20 billion pounds
US Average cost of production: 12 cents per pound
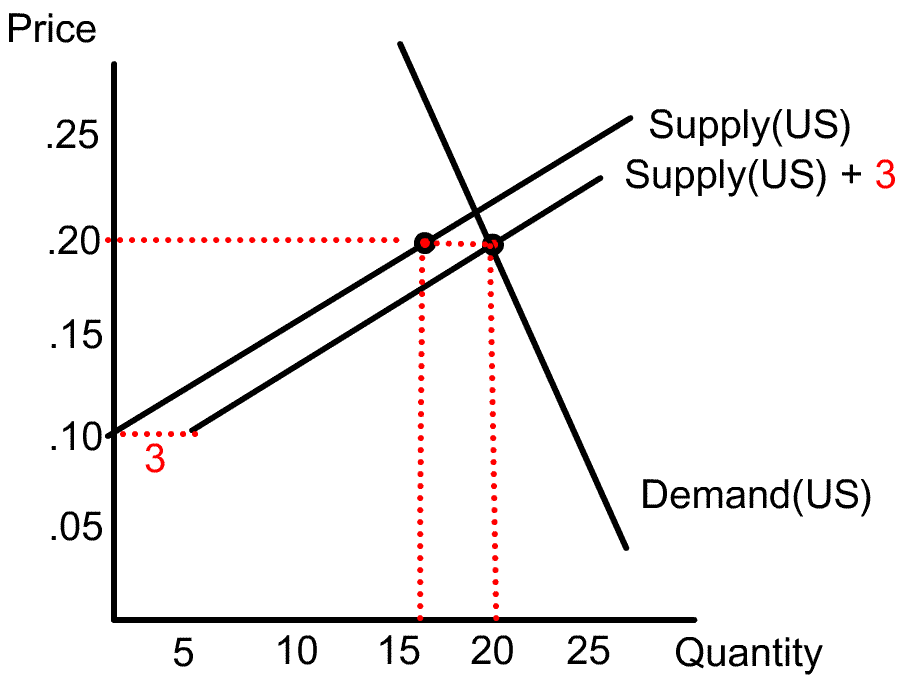
Step One: We know that when the price in the US is 20 cents per pound US producers supply about 17 billion pounds, so the US supply curve goes through the point P=.20 and Q=17. Secondly, production costs per pound of sugar are about 12 cents. So we draw our US supply curve so that if price fell to 10 cents, the US quantity supplied would be zero. This is done in the diagram to the right. 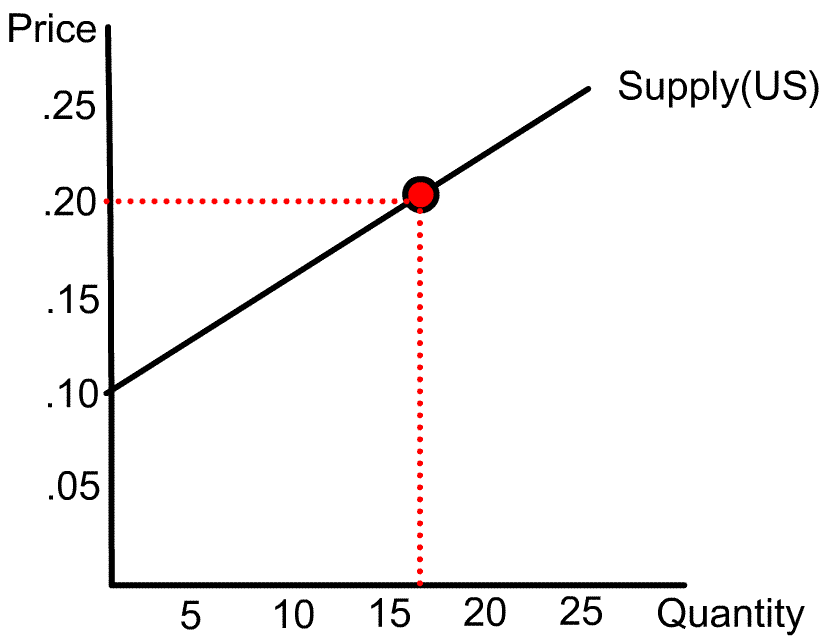
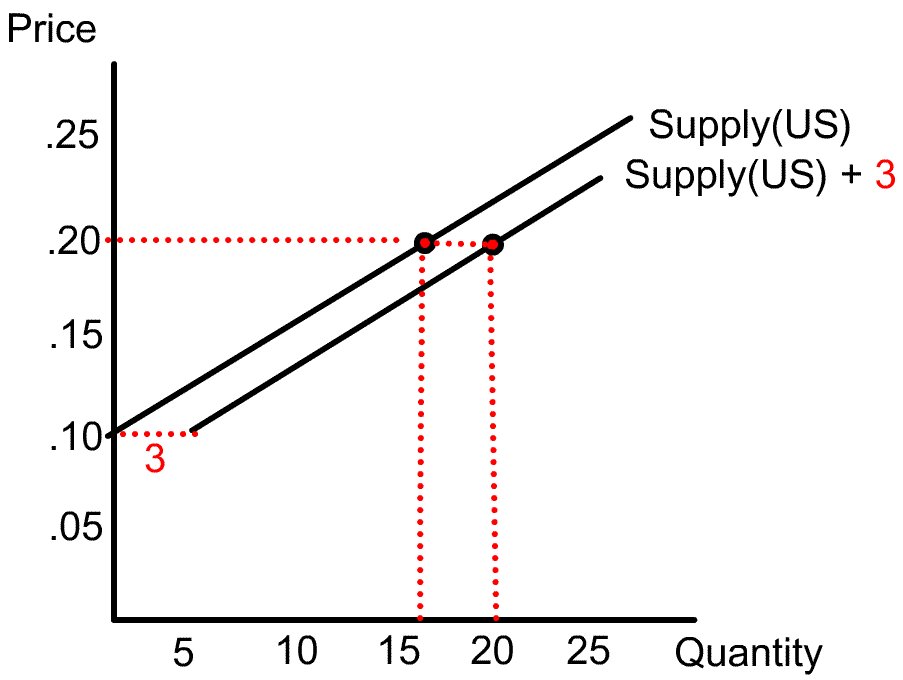 Step Two The sugar import quota system has operated to limit US imports of sugar to 3 billion pounds. So the total supply of sugar in the US market is the Supply(US) plus the 3 that can be imported. This is shown as “Supply(US) + 3” in the diagram to the right..
 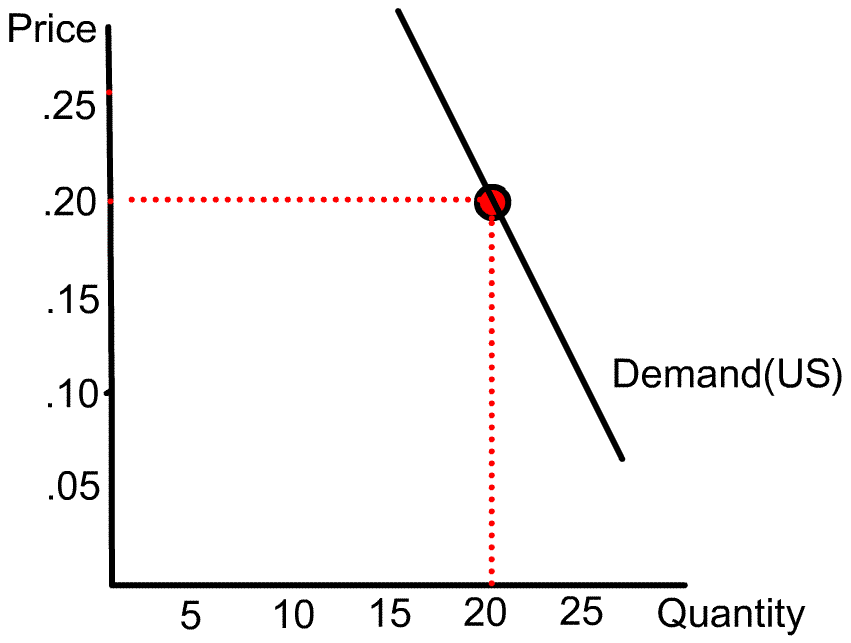 Step Three: We know that when the price in the US is 20 cents per pound US consumers buy about 20 billion pounds, so the US demand curve goes through the point P=.20 and Q=20. This is done in the diagram to the right. Step Four: Putting the supply and demand together we can see how the import quota is set at 3 so that 20 cents is the market equilibrium price in the US .
  Calculating the magnitude of the efficiency loss caused by the sugar import program:Economists argue that trade is benficial to both buyers and sellers. From this it follows that restricitions on trade, like the sugar import program, will cause some loss in efficiency. Now it may be that, as a country, we are willing to incur some efficiency loss in order to pursue some other objective like preserving agricultural lifestyles. Many developed countries restrict trade in agricultural products to protect their domestic farmers. The Japanese restrict rice imports and the Norwegians restrict dairy product imports. The US restricts sugar imports. One job for economists is to calculate the costs of such programs so that more informed decisions can be made about whether it is too costly to have programs like the sugar import quota program. If the cost to the US is only $1 million per year, maybe the program is a cheap way to protect farmers and maintain a vibrant ag community. But if the cost is $100 billion, maybe not. These calculations are provided here.
Questions1. Suppose that due to increases in income, the demand for sugar in the US increased {shift to the right of Demand(US)};a. What is the effect on the price in the US?
b. What is the effect on the quantity supplied by US producers?
c. What is the effect on the quantity of sugar imported?
2. Suppose that the world price of sugar fell from 10 cents per pound to 5 cents per pound. What are the effects on the US sugar market?
3. High fructose corn syrup (HFCS) is a sweetener made from corn. HFCS is a close substitute for sugar. About 50% of food sweeteners come from HFCS in the US. Noting the the sugar import quota raise the price of sugar in the US, analyze the effect of this program on (a) the market for HFCS, and (b) the price of corn.Would corn farmers support the sugar import quota system?
4. Suppose that pressure from the World Trade Organization (WTO) force the US to stop using the sugar import quota system and instead have free trade in sugar. Analyze the effects on the US market if the US were to have free trade in sugar.
5. Refer to Bastiat’s petition for the candlemakers, but rewrite it using US and foreign produced sugar as the example.
Other Related Articles
